Business
October 29, 2025
GOLD REBOUNDS AHEAD OF THE FED’S DECISION: A PAUSE OR THE BEGINNING OF A NEW DOWNTREND?

During the first two days of the week, gold faced heavy selling pressure, dropping by nearly $100 per day on average, with spot prices at one point falling below $3,900 per ounce. By Wednesday (October 29), however, gold rebounded toward the $4,000 mark as markets awaited the outcome of the U.S. Federal Reserve’s (Fed) policy meeting.
Focus: The Fed’s rate decision and President Trump’s Asia tour
The Fed’s two-day meeting is set to conclude today, with a high likelihood of a 0.25 percentage point rate cut. Although such a move typically supports gold prices, investors’ attention is fixed on Chairman Jerome Powell’s forward guidance regarding the future policy path.
If the Fed adopts a cautious tone or signals a potential pause in the rate-cutting cycle, real yields could rise again thereby weighing on gold in the short term.
Pressure from U.S.–China trade developments
Recently, gold prices have been influenced by positive news from U.S.–China trade negotiations. The two nations are said to have reached a framework agreement on tariffs and rare earth export controls, raising hopes of easing tensions.
Additionally, U.S. President Donald Trump announced a 20% reduction in import tariffs on Chinese products containing fentanyl precursors ahead of his summit with President Xi Jinping in South Korea this week — a move that further boosted risk appetite, creating headwinds for gold.
Technical outlook: Head and Shoulders pattern or the start of a new cycle?
After completing a continuation pattern and reaching the $3,900 target, gold broke below the neckline of a Head and Shoulders formation a signal that typically confirms a bearish trend. The current price action appears to be retesting the neckline, and if it fails to break above this level, the pattern could drive gold down toward its technical target near $3,700 per ounce.
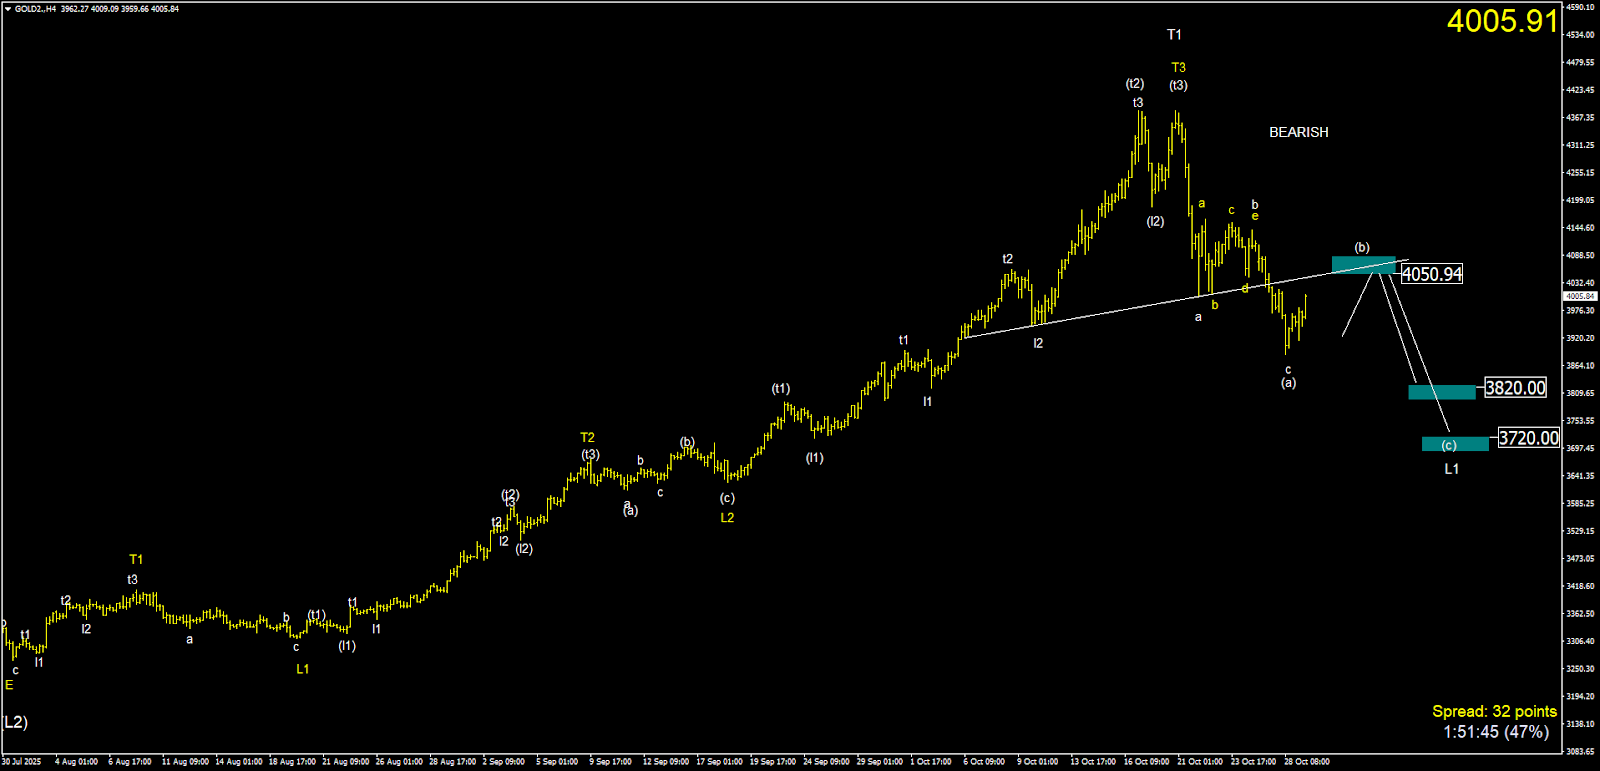
From a wave structure perspective on the H4–D1 timeframe, GOLD has completed wave (a) in white at 3886 and is currently moving upward from (a) to (b).
However, on the flip side, the wave structure also suggests that the $3,886 zone may represent the completion point of wave L2 in white, thereby opening up the possibility of forming an upward wave t1 in white meaning that gold could be entering the early phase of a new bullish cycle.
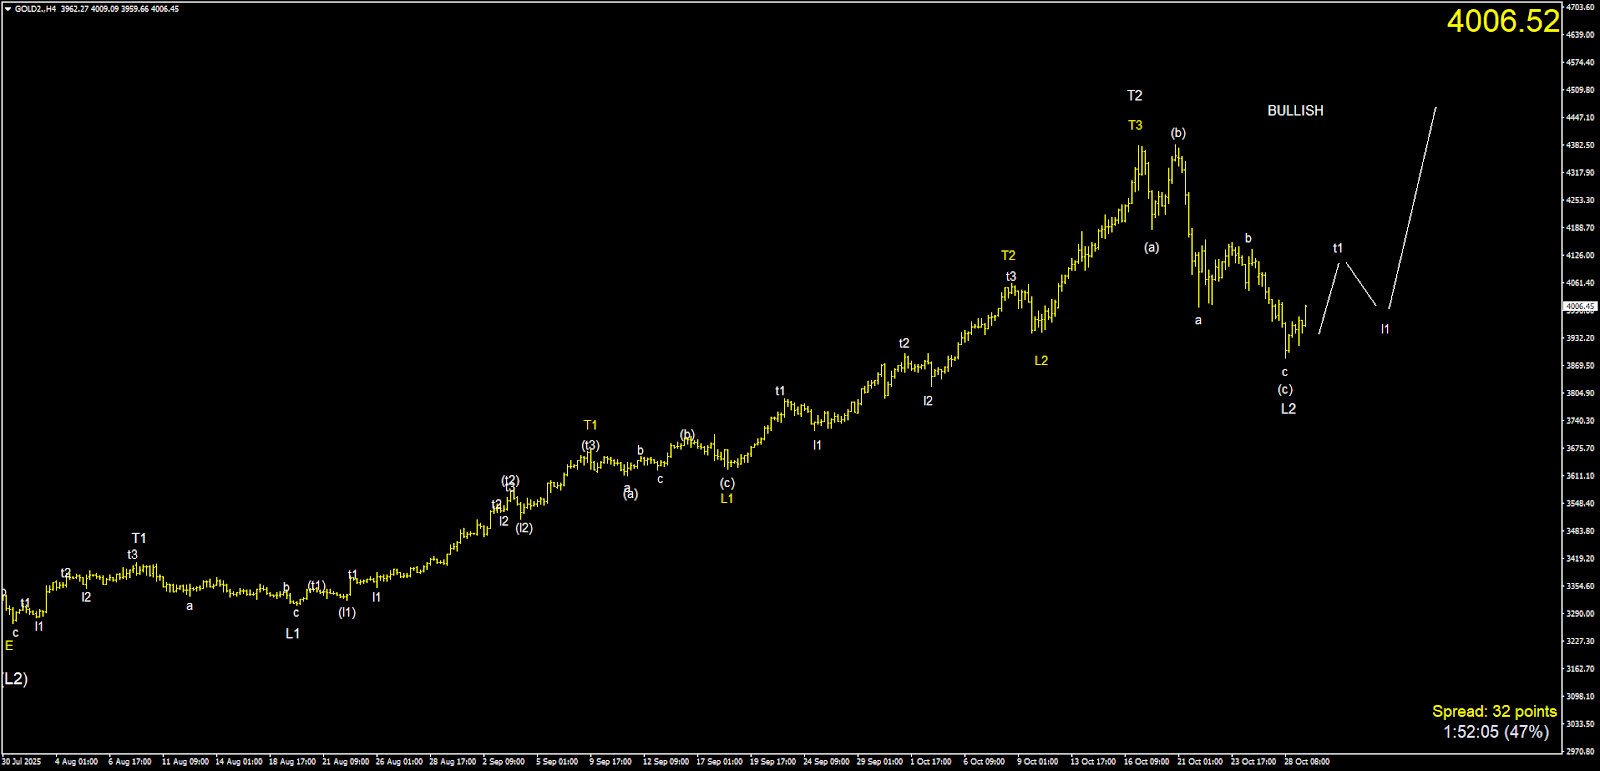
Both scenarios share a common point: gold is likely to stage a short-term rebound, and its reaction after the Fed meeting will play a decisive role in determining the next direction.
Gold at the intersection of risk and expectation
Signs of easing trade tensions and a growing risk appetite are temporarily dampening gold’s appeal. However, the post-Fed volatility will be the key factor in determining whether the current rebound is merely a “technical pause” or the beginning of a deeper downtrend.
Which scenario do you find more plausible?
Share your thoughts and join Ebila AI in tracking, updating, and identifying investment opportunities through a deep, objective, and real-time perspective.
If you find Ebila AI’s analyses helpful, share this article so more investors can gain a clearer and more accurate view of the market.