 15
15Business
July 9, 2026
GOLD PRICES RECOVER AS REVERSAL SIGNALS BECOME INCREASINGLY CLEAR
.png&w=3840&q=75)
Market Context
Gold prices rebounded during Thursday’s trading session after hovering near their lowest level in almost a week. A weaker U.S. dollar helped the precious metal regain upward momentum, partly offsetting pressure from concerns over escalating tensions between the U.S. and Iran.
As of 07:37 GMT, spot gold rose 0.8% to $4,107.69 per ounce, after touching its lowest level since July 1 in previous trading sessions.
Technical Analysis: The Reversal Pattern Is Gradually Taking Shape
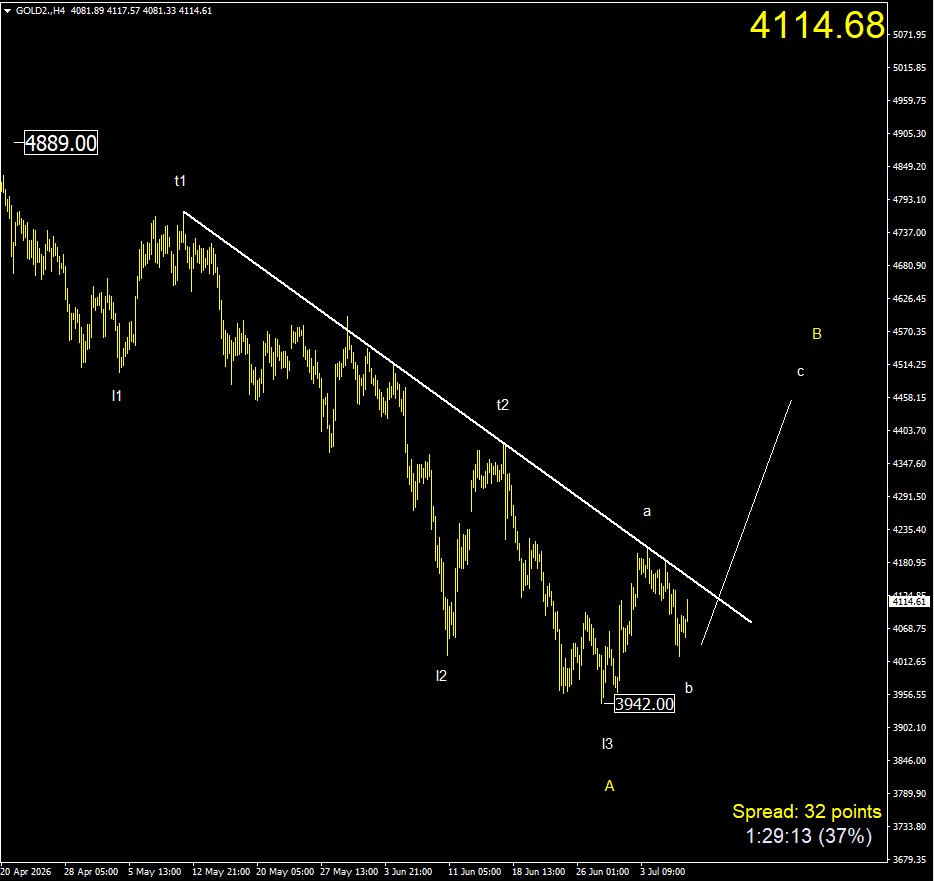
Gold’s pullback since the beginning of the week is considered a normal market movement, serving as a retest of the support area following last week’s breakout signal. This is a necessary confirmation phase to strengthen the short-term bullish trend.
From a wave-structure perspective, price is currently expected to be moving within the upward leg from A to B, with an internal structure consisting of three smaller waves: a-b-c.
In terms of price pattern, gold is gradually forming an inverse head and shoulders pattern, a notable bullish reversal formation. This scenario will be confirmed if price breaks above the neckline, marked by the white line. At that point, the technical signal would further support the view that the upward move from A to B is being established.
Conversely, if price declines below the $3,942 per ounce area, the inverse head and shoulders pattern will be invalidated, and the bullish scenario will need to be reassessed.
Conclusion
Gold’s short-term trend is showing more positive signals as buying pressure gradually returns after the corrective move. Whether price can hold key support areas and move closer to the neckline will be an important factor to watch in the coming sessions. If price successfully breaks above this resistance level, the possibility of a new upward leg will be significantly strengthened. On the other hand, a break below the $3,942 per ounce level would invalidate the reversal scenario and increase the risk of a deeper correction.
Ebila AI continuously updates market developments by combining both fundamental and technical factors, helping investors gain a more comprehensive perspective and make more effective decisions.
If you find Ebila AI’s analysis useful, please share this article so more people can gain a clearer and more accurate view of the market.
All information related to trading in financial markets provided on this website is intended solely for research and educational purposes and does not constitute a specific investment or business recommendation. It should also not be considered an investment opportunity analysis or a general recommendation related to the trading of investment instruments.