Business
November 4, 2025
GOLD MOVES SIDEWAYS AROUND $4,000/oz – KEY DEVELOPMENTS INVESTORS SHOULD FOLLOW

Gold is currently trading around $4,000 per ounce, as investors await a series of key U.S. economic data releases and signals from the Federal Reserve regarding its rate-cutting roadmap. Meanwhile, policy changes in major economies and the ongoing U.S. government shutdown have delayed several crucial reports, adding further uncertainty to the precious-metal market.
Pressure from the U.S. Dollar and Profit-Taking
Over the past week, gold has faced downward pressure as the U.S. Dollar Index approached the 100-point mark, making the metal more expensive for foreign buyers. Profit-taking after the recent rally, combined with easing U.S.–China trade tensions, has weakened safe-haven demand, creating short-term downside pressure.
Key Macroeconomic Developments
U.S.–China Trade Relations: The new trade framework between the two countries has reduced tariff risks, boosting risk assets but putting pressure on gold.
Federal Reserve Policy: The Fed recently cut rates by 0.25%, bringing the target range to 3.75%–4.00%. However, Chair Jerome Powell’s cautious tone dampened expectations for another cut in December, limiting gold’s upside momentum.
China’s New Policy: China has scrapped VAT incentives for gold retailers on the Shanghai Gold Exchange, a move that could curb domestic physical demand.
U.S. Government Shutdown: The prolonged shutdown has delayed several major economic indicators, increasing the risk of “missing data” and fueling market uncertainty.
Overall, shifting global policies are painting a volatile macroeconomic landscape, keeping gold a preferred safe-haven asset — but with wider price swings ahead.
Technical Outlook – Key Levels to Watch
On the H4 chart, gold continues to move below the neckline of a Head-and-Shoulders pattern, maintaining short-term bearish pressure.
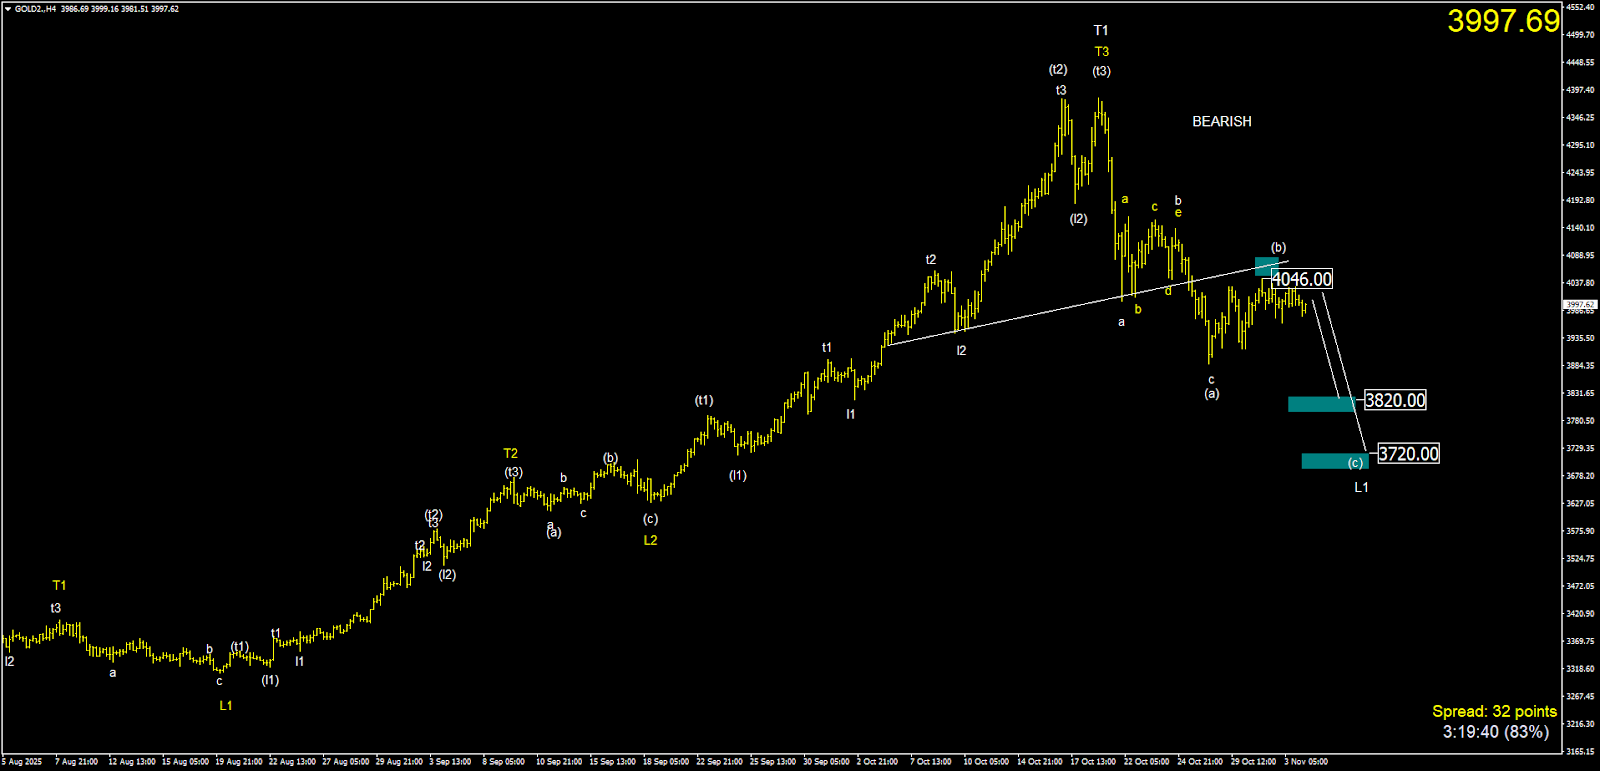
In terms of wave structure, nothing has changed significantly. The (b) white wave peak remains temporarily at 4046, and the downward move from (b) white to (c) is still in progress.
However, to confirm and strengthen this scenario, gold needs to break below the 3962 level.
If gold finds support and rises above 4046, it would suggest that the (b) white point has not yet been fully formed, calling for a re-evaluation of the entire sideways phase.
A Time for Patience and Flexible Strategy
The current sideways phase is a true test of investors’ patience.
As gold continues to fluctuate around the $4,000/oz mark awaiting clearer signals from the Fed and upcoming U.S. economic data the market remains in a “watch and wait” mode.
In this environment, short-term trading strategies may prove more effective than long-term holding.
Medium- and long-term investors should wait for clearer trend confirmations particularly when price breaks out of the 3,960 – 4,050 USD range to secure safer entry points.
Stay ahead with Ebila AI.
Keep up with real-time market updates and explore the most effective short-term trading strategies to ensure you don’t miss out during this “calm before the storm” phase.
If you find Ebila AI’s analysis useful, share this post to help more investors gain a clearer and more informed view of the market.