Business
September 20, 2025(Updated: September 20, 2025)
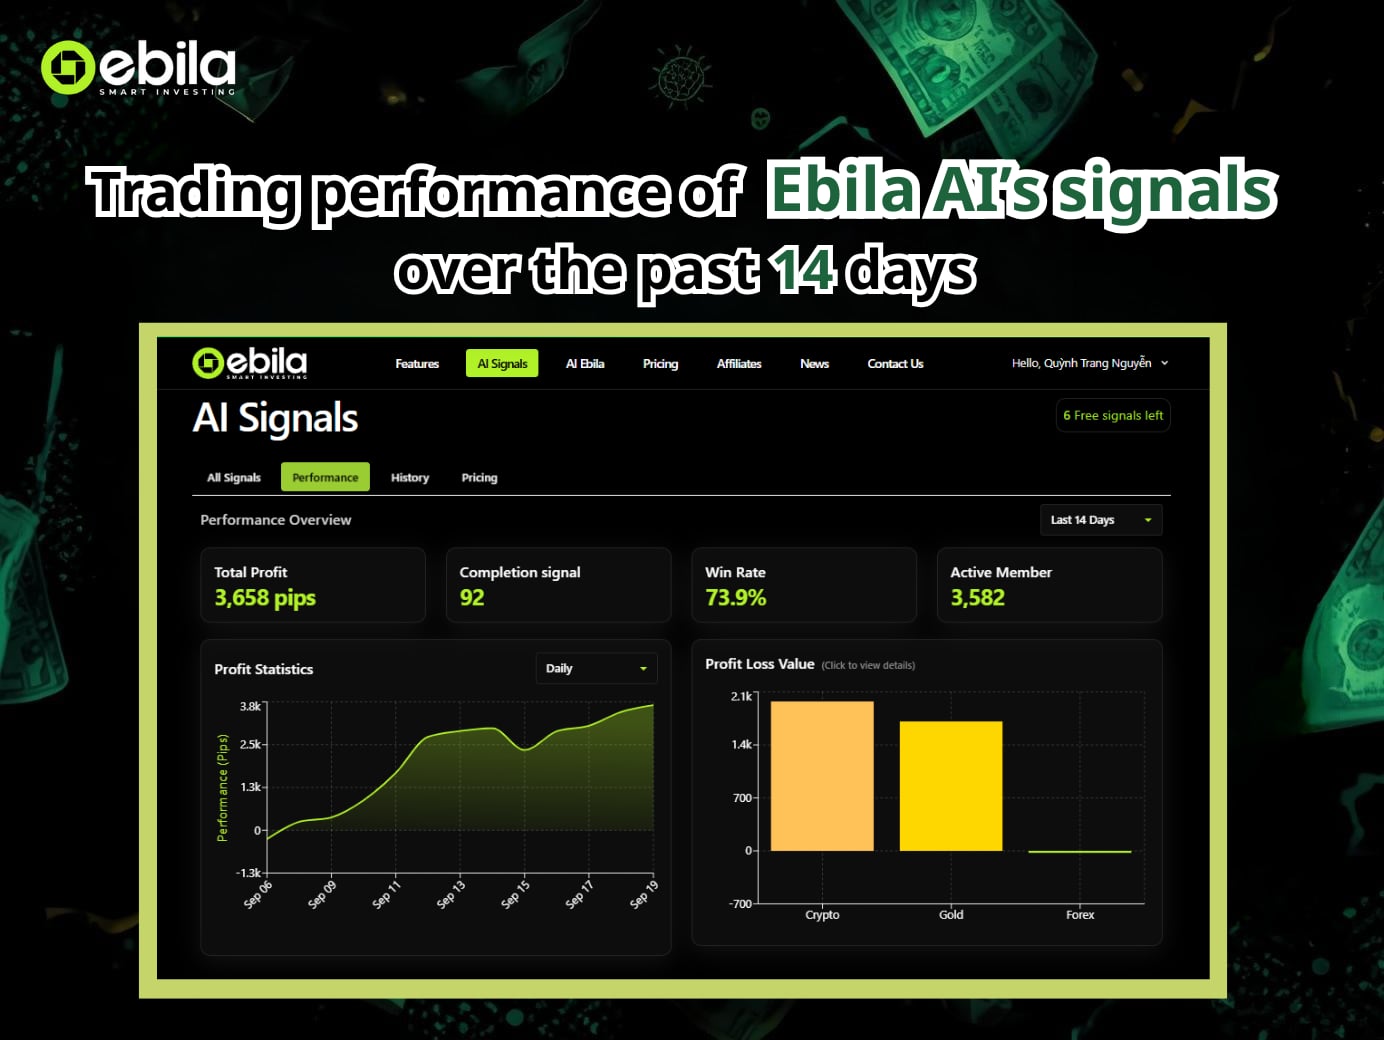
Ebila AI - 14-Day Signal Performance: When Crypto and Gold Drive Returns to New Highs

Over the past 14 days, the Ebila AI platform has reported remarkable trading results, generating a total profit of 3,658 pips from 92 completed signals. The average win rate stood at 73.9%, indicating that the majority of the system’s signals translated into gains, with as many as 3,582 active members currently utilizing the service.
A closer breakdown of returns by market reveals a stark disparity: Crypto was the leading contributor with approximately 1,974 pips, followed by Gold with around 1,710 pips, while Forex contributed relatively little during this period. These figures not only highlight Ebila AI’s market-selection capabilities but also shed light on the system’s resource allocation strategy.
This article will provide an in-depth analysis of these performance metrics, assess the strategic implications of profit distribution, and outline the data limitations and potential risks that investors should be mindful of.
Core Metrics and Their Direct Implications
Total Profit: 3,658 pips (14 days) — a clear cumulative gain over a short cycle.
Completed Signals: 92 — a sample size sufficient to provide initial significance (not extremely large but adequate for consideration).
Win Rate: 73.9% — notably high compared to market benchmarks, suggesting the system’s entry/exit timing was relatively effective during this period.
Active Members: 3,582 — an indicator of community/client confidence, useful for gauging the scale of influence.
Practical Implication: On average, each signal contributed roughly 39.76 pips (3,658 pips ÷ 92 signals). This translates to approximately 6.57 signals per day and an average of 261.29 pips per day over the 14-day span.
Time-Series Performance Analysis
The daily profit chart reveals three distinct phases:
Initial Volatility (Days 1–4): At times, returns dipped into negative territory, reflecting either a “testing” phase or heightened market turbulence.
Breakout Phase (Days 5–9): Profits accelerated sharply, contributing the majority of the 14-day total.
Consolidation & Recovery (Days 10–14): Mild corrections occurred, followed by a renewed upward move, ending at elevated levels.
This pattern indicates that Ebila AI does not generate a “flat” or linear performance curve. Instead, it follows a cycle of entry–breakout–recovery, consistent with a system designed to capitalize on momentum in volatile markets.
Market Allocation — A Focused Strategy
The Profit-Loss Value chart highlights the following distribution:
Crypto: ~2,000 pips — the largest contributor.
Gold: ~1,720 pips — the second key driver of returns.
Forex: minimal contribution during this cycle.
Ebila AI appears to have concentrated its trade selection in Crypto and Gold over the past 14 days, likely due to favorable volatility and trending conditions in these markets. The relative neglect (or limited exposure) to Forex may represent a deliberate strategic choice aimed at optimizing profitability under current market dynamics.
Investor Guidelines for Using Ebila AI Signals
While the past 14 days have demonstrated Ebila AI’s impressive performance, directly applying these signals into live trading still requires caution and a disciplined risk management approach. Below are several key recommendations for investors to consider:
1. Capital Risk Management
A 73.9% win rate is an encouraging figure, but it does not eliminate risk. Each investor should implement strict money management rules for example, risking no more than 1–2% of total capital per trade. This principle helps preserve account equity during short-term losing streaks and prevents “all-in” behavior that could lead to significant losses.
2. Forward Testing Before Scaling Up
Before allocating larger capital, investors should test the signals on a demo account or a small live account for at least one to two trading cycles (around one month). This forward test helps assess the compatibility between the AI’s strategy and the investor’s personal trading style, while also accounting for practical costs such as spreads, commissions, and slippage.
3. Incorporating Personal Filters
Even though AI can process vast amounts of data, investors should supplement it with their own filters based on risk appetite and market context. Examples include trading only during high-liquidity sessions, prioritizing volatile pairs or assets, or factoring in macroeconomic events (e.g., Fed or ECB announcements, CPI releases) before executing trades.
4. Monitoring Real Trading Costs
In markets like Crypto, where spreads and liquidity can shift rapidly, “paper profits” may differ significantly from net realized gains. Therefore, close monitoring of slippage and spreads on one’s own trading account is essential to accurately assess the effectiveness of Ebila AI’s signals.
Ebila AI has demonstrated its ability to deliver effective short-term trading signals, with a high win rate and impressive cumulative profits. It serves as a powerful decision-support tool for investors, yet success still requires investor proactivity and sound risk management skills. The system’s true effectiveness ultimately depends on how capital is allocated, whether strategies are properly validated, and if personal filters are applied to align with current market conditions.
AI technology undoubtedly provides an edge in data processing and opportunity detection, but it cannot eliminate the inherent risks of volatile markets. Therefore, the final responsibility as well as the ability to preserve and grow capital rests with the investor. It is the combination of technological power and disciplined management that forms the key to sustainable success in investing.