Business
October 21, 2025
Decoding the Signal: Is Ethereum Ready for a Comeback?

After several weeks of hovering between $4,000 and $5,000, Ethereum (ETH) experienced a sharp sell-off, plunging to around $3,400. However, shortly after, ETH rebounded more than 20%, climbing back to the $4,300 zone.
The question now is: Has Ethereum’s next bullish trend truly begun?
Tom Lee: “Ethereum Is Entering a Super Bull Cycle”
According to Tom Lee, Chairman of BitMine, Ethereum is preparing to enter a super bull cycle, making the current price level an attractive opportunity in terms of the risk/reward ratio.
He revealed that BitMine carried out a large-scale Ethereum purchase right after the crypto market experienced one of the biggest leverage wipeouts since the beginning of the year.
“ETH open interest has now returned to the level of June 30 — when ETH was trading at just $2,500.
With the expected super cycle ahead, the current price offers an exceptionally compelling risk/reward setup.”
— Tom Lee, Chairman of BitMine
Data from Arkham Intelligence shows that BitMine recently acquired an additional $250 million worth of ETH via BitGo and Kraken, bringing its total holdings to 3.3 million tokens (approximately $13 billion).
This accounts for 2.74% of Ethereum’s total circulating supply, meaning BitMine has already surpassed the halfway point of its goal to hold 5% of all ETH in circulation.
Technical Outlook: Signs of a New Uptrend?
On the D1 chart:
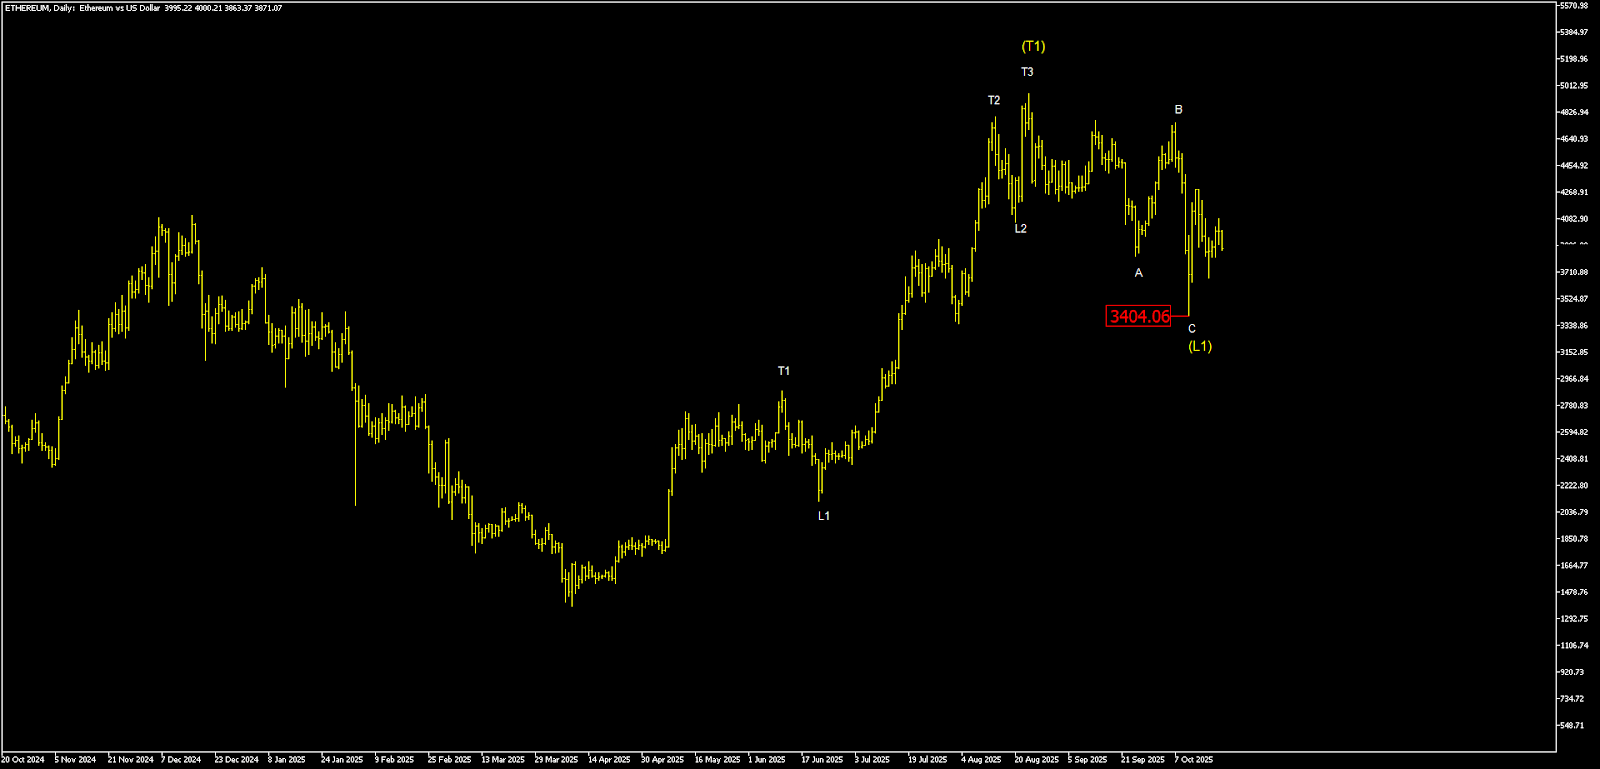
ETH has completed the (T1) gold wave at $4,954 and is now in a corrective phase from (T1) → (L1), following an ABC wave structure.
It is highly likely that the (L1) gold point was established during the recent decline around the $3,404 zone.
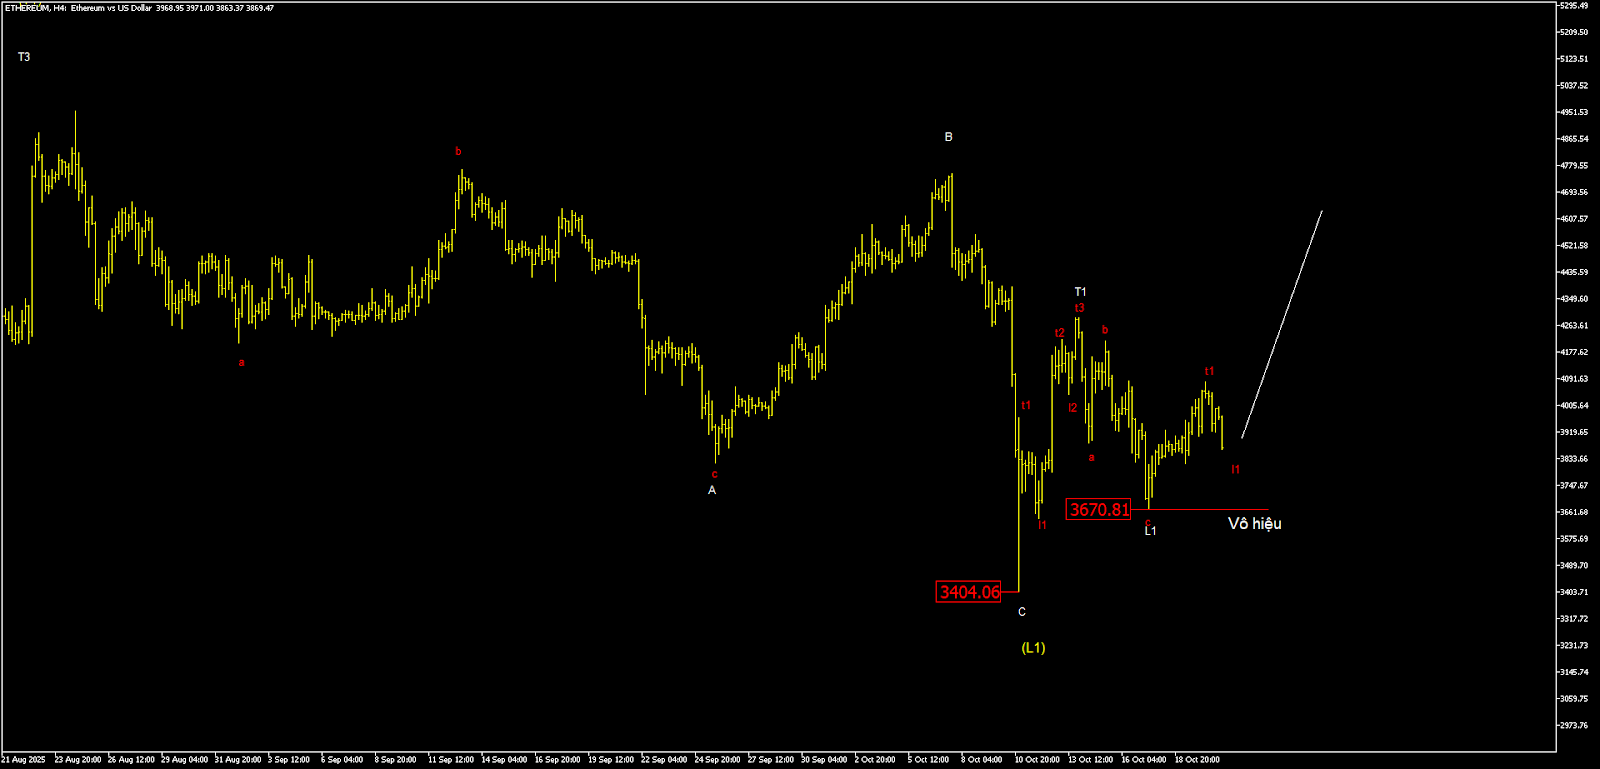
On the H4 Chart:
ETH is showing early signs of a new bullish wave, as the price has formed a five-wave red impulse from the (L1) gold bottom up to T1 white.
Subsequently, the price retraced to the 61.8% Fibonacci level of the T1 wave before bouncing sharply, further reinforcing the possibility that a new upward cycle is taking shape.
Key Price Levels to Watch
Immediate Resistance: $4,300
Next Resistance: $4,600
Extended Target: Retest of the All-Time High (ATH)
On the downside:
If the price drops below $3,670, the white L1 point may not yet be complete.
A deeper decline below $3,404 would indicate that the gold (L1) wave is still extending, suggesting the potential for a further corrective move.
In such a scenario, investors should reassess the overall mid-term trend before taking any action.
All markets — gold, currencies, and digital assets — are continuously monitored and analyzed by Ebila AI, which identifies investment opportunities from a deep, objective, and real-time perspective.
If you find Ebila AI’s analyses helpful, share this article so that more readers can gain a clearer and more accurate understanding of the market.
Disclaimer
This article is intended for informational purposes only as a personal blog post and does not constitute investment advice.
Investors should conduct their own thorough research before making any decisions. Ebila AI is not responsible for any investment outcomes resulting from the information provided herein.
In accordance with Resolution No. 05/2025/NQ-CP dated September 9, 2025 by the Government of Vietnam, regarding the pilot implementation of the digital asset market in Vietnam, Ebila AI currently provides information solely to international readers and does not serve users in Vietnam until official guidance from the relevant authorities is issued.