Business
October 27, 2025
Continuation Pattern Emerges: Can the 4,000 Support Zone Hold?

At the opening of the Asian session on Monday (October 27, 2025), gold prices extended their decline, continuing last week’s downtrend as U.S.–China trade tensions eased. The improving geopolitical outlook weakened safe-haven demand, while risk appetite returned to equity markets. Investors are now turning their focus to major central bank meetings this week, seeking clearer signals on the pace of rate cuts.
Spot gold fell 2.1%, touching $4,024 per ounce at 15:55 GMT+7, after reaching a record high of $4,381.30 per ounce on October 20.
Stocks Rise as Gold Loses Its Safe-Haven Appeal
Asian stock markets opened higher on Monday, as signs of easing U.S.–China trade tensions drove capital back into risk assets. Giovanni Staunovo, a commodities analyst at UBS, noted:
“A potential trade deal between the U.S. and China is supporting risk assets and weighing on gold. However, lower import tariffs could also pave the way for deeper rate cuts by the Fed.”
President Donald Trump also confirmed that both sides are “close to reaching a trade agreement” and will meet Chinese President Xi Jinping in the coming days in South Korea.
Fed Poised for Rate Cut – A Hidden Support Factor
Markets have fully priced in a 25-basis-point rate cut by the Federal Reserve in its meeting this Wednesday. Attention now shifts to Chair Jerome Powell’s remarks, as investors look for clues on a potential deeper easing cycle.
Staunovo added:
“Lower real interest rates remain a long-term supportive factor for gold. Therefore, volatility around the upcoming FOMC meeting may be limited—unless the Fed delivers a surprise signal.”
Technical Outlook: Bearish Continuation Pattern Activated
On the H4–H1 timeframe, gold is forming a bearish contracting triangle, characterized by:
Lower highs on each successive peak,
Gradually higher lows, and
A narrowing price range.
This structure often signals a consolidation phase before a strong breakout in the prevailing downtrend.
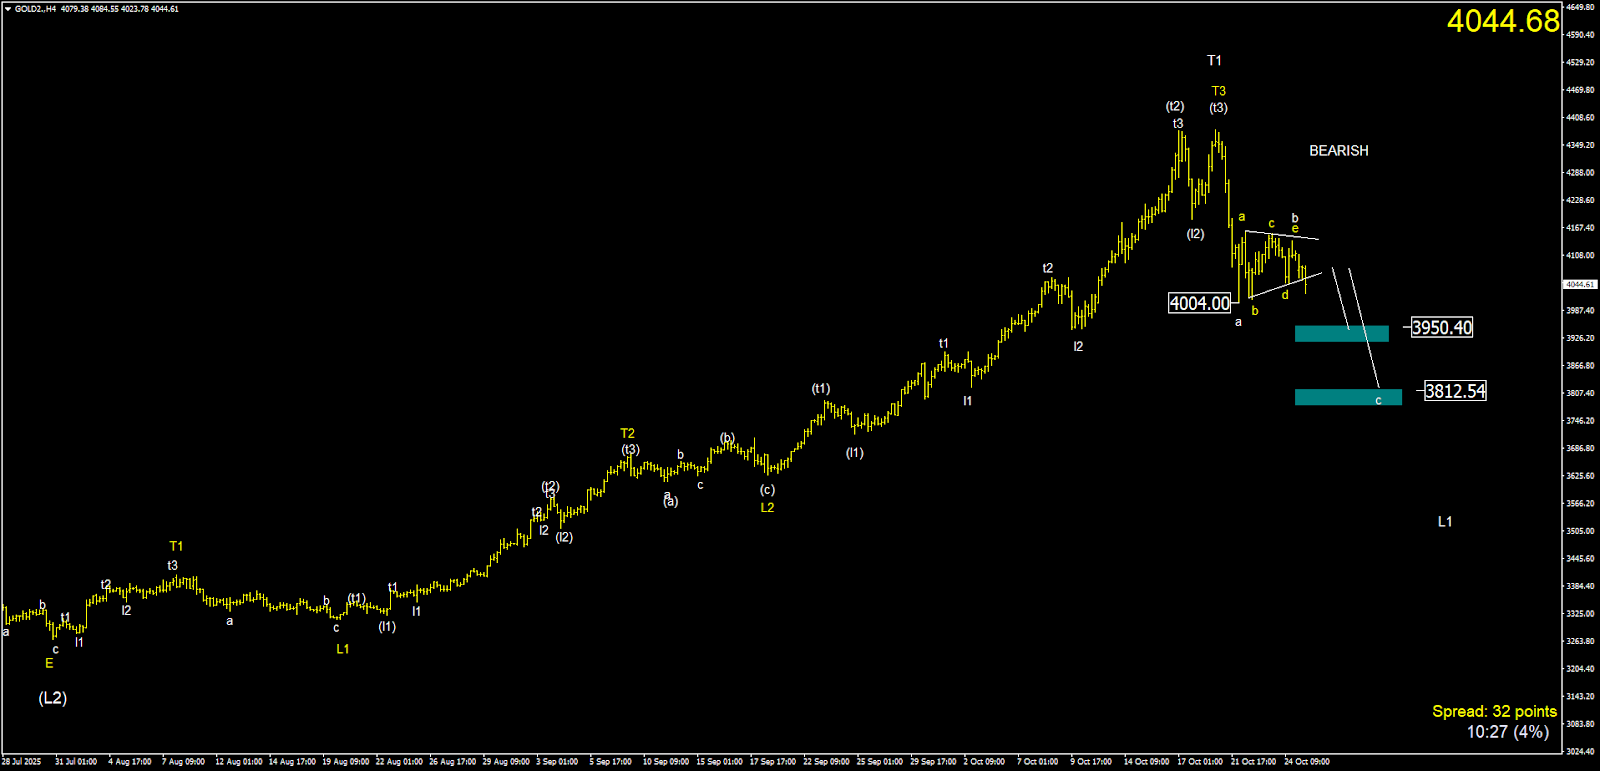
Currently, gold prices have broken below the lower boundary (bd line) of the pattern — a signal confirming that the bearish continuation setup has been activated.
According to technical projections, the downward move could extend toward the $3,900/oz zone. However, along this path, traders should keep a close watch on key support levels at:
$4,000 – $4,020/oz (critical zone),
$3,940 – $3,950/oz, and
$3,900/oz as the extended target
The $4,000 Zone – The “Last Defense” for Buyers
The $4,000/oz level now stands as the short-term make-or-break line.
If prices manage to hold this zone and rebound above the recent minor peak (E wave), the bearish continuation pattern would be invalidated, paving the way for a recovery scenario.
Conversely, a decisive break below $4,000 would confirm an extended downside toward $3,900 or lower. In that case, investors should shift focus to risk management, waiting for clearer signs of stabilization before considering new long positions.
Gold at a Critical Crossroad
Gold is currently at a pivotal junction caught between expectations of a Fed rate cut and a renewed global risk-on sentiment.
While technical structures still suggest bearish pressure dominates, the $4,000/oz level remains the ultimate test that will determine gold’s next directional move.
All market insights from gold, currencies, to digital assets are continuously analyzed and updated by Ebila AI, offering deep, objective, and real-time investment perspectives.
If you find Ebila AI’s analysis valuable, consider sharing this post so more investors can gain a clearer, data-driven view of the market.