Business
October 22, 2025
AFTER THE HISTORIC PLUNGE, HOW MUCH FURTHER COULD GOLD FALL?

Gold has just experienced the sharpest plunge in its history, tumbling $380 per ounce equivalent to 8.67% in only 32 hours, from the peak of $4,381 down to nearly $4,000 per ounce.
This marks the largest two-day decline ever recorded in the era of modern gold trading. The key question for investors now is: Has gold finally found its bottom or is there still room for a deeper fall?
The Big Picture
The precious metals market has just witnessed a violent correction, one that seems “overdone” for an asset class typically regarded as safe-haven and risk-averse like gold.
However, for professional traders, this plunge was not entirely unexpected it had been anticipated in previous analyses.
>>> Gold’s Pullback: A True Reversal or Just a Pause Before the Next Surge?
In the weeks leading up to this event, gold had rallied too far, too fast, without any meaningful correction. This prolonged climb gradually built up pressure for a major sell-off. Since August 2025, when gold was trading steadily around $3,300 per ounce, the price had soared by more than $1,000 without any consolidation virtually guaranteeing a significant correction once momentum reversed.
Technical Perspective: The Formation of the ABC Correction Wave
Compared with the earlier forecast of gold’s pullback, the current wave count classification has been updated. Under the latest wave structure, analysis indicates:
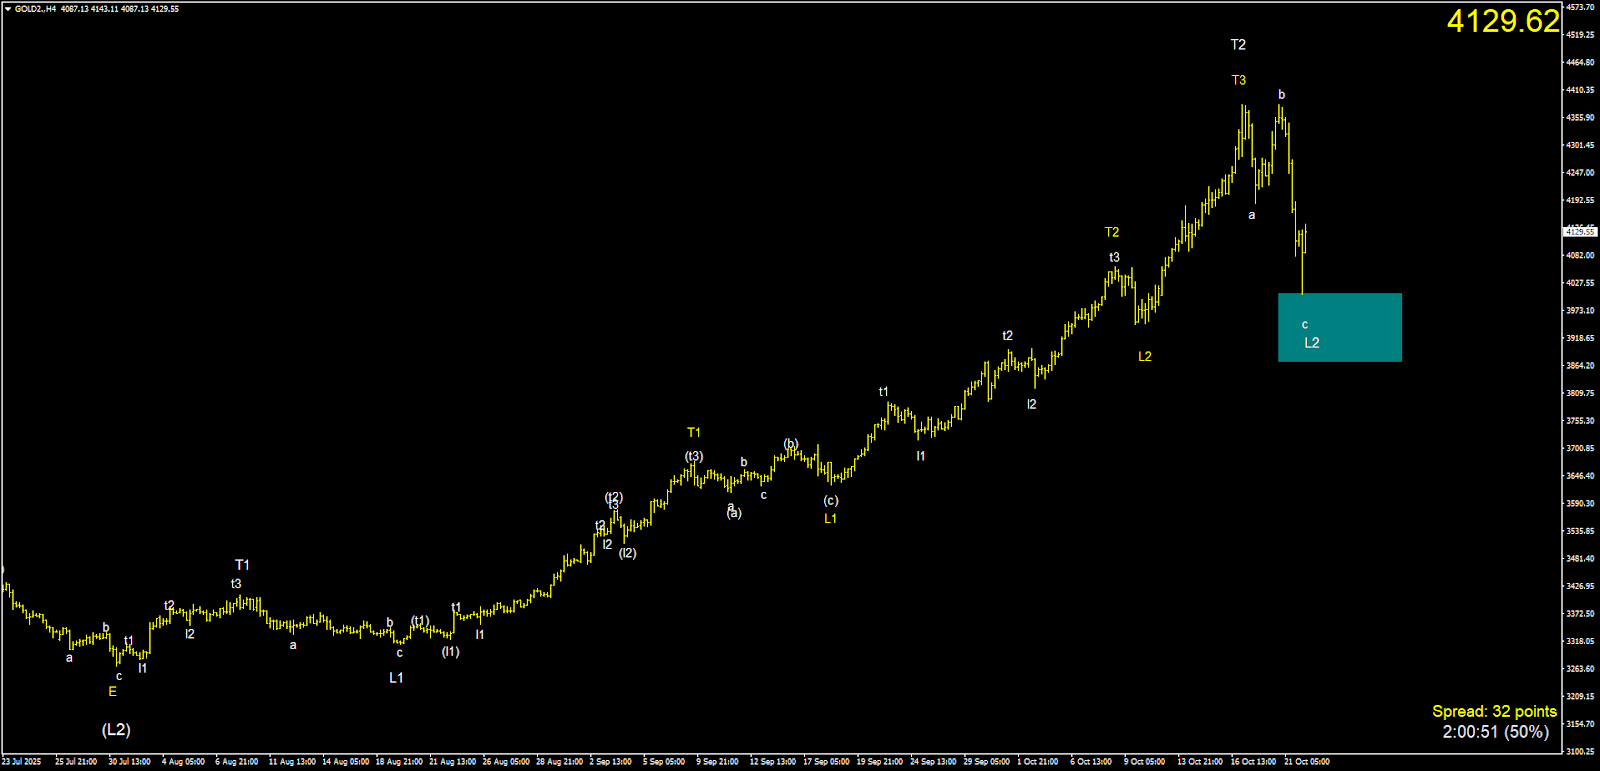
Gold has completed its White T2 wave at the $4,380 peak.
It is now undergoing a corrective phase from T2 down to White L2.
Over the past two days, the structure of the ABC corrective wave has become increasingly clear. Prices are now approaching the 38.2% – 50% Fibonacci retracement zone of the previous rally an area that often serves as the formation point of the L2 wave.
According to Elliott Wave Theory, once the White L2 wave is complete, gold is likely to rebound sharply, paving the way for the next upward T3 wave, which could lead to new highs in the upcoming cycle.
Scenarios to Watch
However, if prices break below the current support zone, the bullish scenario will be temporarily invalidated. In that case, gold could enter a medium-term corrective phase, forcing investors to reassess the broader trend structure.
A Technical Correction — Not a Reversal
Although the recent plunge was shocking and the steepest in history, it appears to be a short-term overreaction, while the long-term outlook remains constructive. Most likely, this is merely a technical and psychological correction, rather than a true trend reversal.
This is a necessary consolidation phase, helping the market build a stronger foundation for the next upward cycle.
Investors are advised to closely monitor key support zones, avoid bottom-fishing too early, and wait for confirmation signals before taking action.
Across gold, currency, and digital asset markets, Ebila AI continuously provides real-time updates and identifies investment opportunities through a deep, objective analytical perspective.
If you find Ebila AI’s analysis helpful, consider sharing this article so that more people can gain a clearer and more informed view of the market.